Business Analytics Capstone Experience
The Business Analytics Capstone Experience allows students to work on real-world business problems using data and statistics.
Graduate students work with a UM-Dearborn faculty advisor and a mentor from a sponsoring company to model, analyze and recommend a solution for a significant business problem.
Sponsoring a Capstone Project
The curriculum for the Master of Science-Business Analytics in the College of Business prepares students to deal with the challenging task of deriving deep insights from the vast array of structured and unstructured data in a variety of business areas. The program prepares students to pursue careers such as a data scientist or analyst.
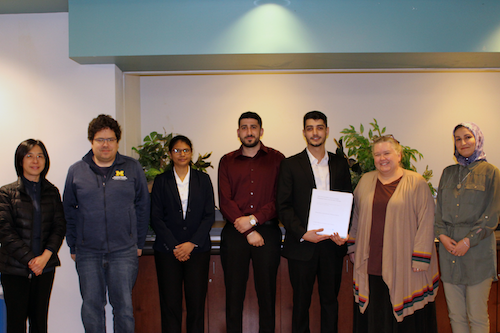
The capstone project is the core of the MS-Business Analytics curriculum. This 15-week course emphasizes a team-based learning experience in which students conduct real-world analytics projects using data provided by the sponsoring organization. Since Winter 2016, students have completed 25 projects with 9 sponsoring organizations. Some of the industry sectors represented by our sponsors include manufacturing, healthcare, energy, retail, logistics, information technology, and service. Student projects have included optimal supply-chain logistics configuration, health-care services profitability analysis, predictive modeling for parts classification, analysis of customer satisfaction in a call center, forecasting weather-related power outages, data-modeling for smart mobility, augmented analytics & conversational analytics for data mining applications, information assurance trend analysis, and learning analytics.
Sponsoring a project provides MS-Business Analytics students an opportunity to gain experience applying their coursework to real-world business problems.
It also offers the sponsoring organizations the opportunity to work with our students. Many organizations make formal offers of employment to project participants after their work in the capstone project.
Only select students participate in the Capstone course. These students are selected on the basis of:
- Superior academic performance in the graduate program.
- Successful completion core courses in statistical modeling and analysis, optimization, forecasting, and data mining.
- Demonstrated teamwork and problem-solving skills.
Course Deliverables:
- A formal written project report.
- A software demonstration (if developed for a particular application)
- A public presentation summarizing the project results.
There is no cost to sponsor a project.
- A project lead who will interface with the student team and Faculty Coordinator on all project matters.
- 2 to 3 hours each week for meetings with the student team, either in person or online.
- A brief, well-defined problem statement. The solution to the problem must require quantitative analysis, such as statistical analysis, optimization, predictive modeling, data mining, visual analytics, and exploratory analysis.
- A prepared data set that requires data modeling, such as data cleansing, data preparation, data normalization, data merging, or data parsing. Students must be able to analyze the data using natural languages, such as R or Python.
Project teams sign a non-disclosure agreement to protect the privacy of the data and other information shared by the sponsor. Sponsors may anonymize business-sensitive information and other technical details.
At the start of the semester, the sponsor and students meet to discuss the following:
- The organization’s business problem.
- The specific goal of the data analytics project.
- A description of the available data.
- Project-meeting schedules between the sponsoring organization and the student team.
The goal of the project is for students to:
- Understand and clearly define the business decision problem.
- Process and analyze data.
- Design, model and develop a solution.
During the project, student teams maintain regular communication with the project sponsors through scheduled site visits, web meetings and weekly progress updates. The Faculty Coordinator tracks project progress with technical reviews and updates with the student teams throughout the semester. In addition, the Faculty Coordinator and project sponsors jointly conduct mid-term progress reviews and provide feedback to the student teams.
The University provides student teams with access to an extensive portal of prominent software in a cloud-based environment, which students will use on their projects.
At the conclusion of the project, the student teams will make a public presentation of their findings to the sponsor, College of Business faculty, staff and students.
The Capstone project course is offered two times a year, during Fall and Winter semesters. We welcome your inquiries about sponsoring a Capstone project. We are always planning for projects for upcoming semesters. The tentative schedule is as follows:
- Problem identification and project planning:
- Through August 15 in any calendar year for Fall semester.
- Through November 15 in any calendar year for Winter semester.
- Project kick-off meeting:
- First Wednesday for Fall semester.
- First Wednesday for Winter semester.
- Final presentation to sponsor:
- Wednesday of the Final Examinations week for Fall semester.
- Wednesday of the Final Examinations week for Winter semester.
Capstone Projects for Winter 2023
This study presents the development of an automated mechanism for log and user affiliation change monitoring using Python scripts. The current practice of manual log queries and affiliation change observations is not only cumbersome but also poses potential security risks due to delays in observation. To address this, the proposed solution automates the process of accessing the application system and logs to generate alerts. The use of Python scripts enables efficient performance and scalability while reducing the need for manual involvement. The developed solution is expected to improve the overall security and monitoring of the system by providing real-time alerts and reducing response time. Though, the current solution of the study is via python scripts, Splunk's built in alert system and pubsub were also thought of as alternatives but were not feasible for security concerns and lack of ability to specialize respectively.
The University of Michigan is devoted to providing a learning environment that is comprehensively accessible, a fact exemplified by the Electronic and Information (EIT) Standard Practice Guide (SPG) of 2022. In line with the university’s accessibility goals, Information Technology Services (ITS) at the university endorsed the Universal Design Online Content Inspection Tool (UDOIT), an automated accessibility checker tool used at the university since 2019. The onset of the COVID-19 pandemic brought about pressing circumstances that halted ITS’s promotion of the tool and clouded their understanding of its usage at the university. This study leverages learning analytics to drive ITS’s assessment of the efficacy of UDOIT as an accessibility tool. It utilizes the concepts of Axiomatic System Design to systemize the design process. The study expounds the methodology used to construct a complete dataset using UDOIT output. Using a predefined set of research questions, the study conducts a full-scale analysis of the dataset, leveraging descriptive statistics with data visualization to identify patterns in the usage of UDOIT across semesters, colleges, users, and more. The study concludes with a structured summary of results and a user manual allowing ITS to replicate this analysis. Insight gained from this study will guide future UDOIT training and support ITS’s efforts towards enhancing digital accessibility at the University of Michigan.
Canvas learning management system. The study identifies the module design and item addition patterns of faculty in Canvas and their relation to student behavior in traversing through course modules. Additionally, the study aims to determine the level of Canvas awareness among faculty and propose instructional design improvements to enhance the user experience. The analysis revealed an increase in the percentage of courses that have only the 'modules' tool enabled on the left-hand navigation during the During-Covid and Post-Covid timeline. The study also provided information on the percentage of courses in each department that used different tools during different terms. The navigational analysis of Canvas usage by learners across different academic units revealed that the School of Social Work stood out in terms of the frequency of tools accessed. Interestingly, despite the expectation that the School of Public Health would have the highest percentage of module usage due to receiving the highest level of instructional support, this was not the case. Providing instructional support can significantly enhance user engagement with Canvas. The analysis suggests that ITS teaching and learning prioritize the implementation of instructional support across all academic units to facilitate continuous user engagement with course content, as evidenced by the higher usage of the Modules tool throughout active sessions. Based on the findings, the study recommends exploring several areas for further investigation, including analyzing child tools usage, exploring the correlation between student grades and time spent on Canvas, and analyzing user navigation for external tools integrated with Canvas. These findings can help identify areas that require more instructional support to improve the user experience on Canvas.
Recent Projects
My Learning Analytics (MyLA) is an optional additional dashboard design tool embedded within Canvas. It offers assignment planning, grade calculations, and resources accessed features to help students engage in self-regulated learning. We analyzed student, course, and log data for 3,929 students enrolled in 61 courses offering the MyLA tool over 4 terms. Using this data, patterns of student activity were identified with the tool and tested for correlation between the use of the tool and course performance.
Multiple methods were developed to classify and separate students into two groups: users of the tool and non-users. The data was used to identify any similar academic or demographic characteristics among students. After analyzing the data, it was determined that there is a significant positive difference between users and non-users of the MyLA program when it comes to course performance. This difference in final course grade increases in magnitude and significance when users are determined by having two or more distinct weeks active in MyLA.
This project identified and analyzed all the departments across the University of Michigan-Ann Arbor that are vulnerable to hacking.
The student team used Tenable.io, an industry-standard tool used to identify hacking risks within an organization's IT systems. The tool provided a massive data set containing all UM IP addresses, each of which was rated as far as its vulnerability to a cyber attack. Students matched this list with a file containing department names and their corresponding subnets.
Students performed data wrangling and data filtering on these two files to retain IP addresses corresponding to severe CVSS (common vulnerability severity rating) and VPR (vulnerability priority rating) ratings. Students then used the Python tool ipaddress to map IP addresses and IP subnets from either of the files to produce a list of the departments that are most vulnerable to hacking. After the mapping process, students analyzed and created a data visualization of the list of IP subnets and departments to identify how often each department was flagged a vulnerable to hacking. The students repeated this analysis over three consecutive months.
The students' work identified the UM departments which are the most vulnerable to hacking -- which turned out to be UM's Information Technology Services itself, followed by the College of Engineering.
With the rise of messaging apps and social media technology being used as a main form of communication, U-M's Office of Budget and Planning wants to be able to quickly and conveniently analyze student survey data over the last 5 years. Gathering useful information about student needs and expectations is vital to help the University decide which technologies they should adopt to communicate with students to maintain a better student-university relationship. Chatbot and Voice Assistant are primarily being used to support staff by gathering the information they need from the student survey data. This project will task students to utilize Google assistant to answer questions and Dialog-flow to create a seamless interaction between users and system.
U-M’s Information Technology Services has collected a lot of data over the years through various activities across the Ann Arbor campus. The Office of Budget and Planning wants its staff to have the ability to run reports and gain insights from the UMay survey data. Students will be tasked to design a model by implementing and creating Augmented Analytics that will connect the end-user to this large set of raw data. This will include the ability to process verbal queries and respond with visual analytics, which will make it easier for the end-user to understand the results.
Ford Motor Company has expanded into mobility services with the purchase of a startup company, Chariot, which offers a carpooling service to commuters in select urban areas and uniquely allows potential customers to vote on new commuter routes. To support Ford and Chariot in identifying new commuter routes in cities where the company is not operating, this research effort created a process that simulates commuter origin and destinations, the number of commuters, and time of departure. The process selected San Francisco, CA as a starting point in part for verification purposes because Chariot already has operations in the city. Results indicate the process properly simulated commuter flow. Specifically, commuter’s origin locations were highly dispersed across San Francisco, but the destination locations indicate commuters are traveling towards areas of high employment. The process also accurately simulated departure times associated with the rush hour commute. In summary, the process created can be replicated to model commuter traffic patterns in other cities and identify where large of commuters are traveling from and to and during what time of day. Thus, the process provides Ford and Chariot commuter data to help guide early business decisions. An end-to-end analytics framework was utilized to process publicly available data from a very large number of sources by utilizing advanced data mining, visual analytics and simulation techniques to generate traffic flow inputs for advanced transportation network and simulation models.
DTE Energy, the electrical service provider for Southeast Michigan, allocates a great deal of resources toward managing outages, particularly those caused by big weather events. This research project aimed to develop a series of models which are geographically sensitive (at the service center level) to predict number of power outages per day based on weather data. Using an ensemble of neural networks, a model for each service center was created that is sensitive to three different scenarios. These models, specifically those belonging to the four service centers which experience the greatest number of electrical service interruptions, predict number of outages in that service center to an industry benchmark level of accuracy. Further, one scenario—high temperature and high wind speed days—predicts outages substantially beyond industry benchmarks. Finally, we discuss our attempt at a more time sensitive model, predicting outages hourly. An end-to-end data analytics framework was utilized to process large disparate datasets by utilizing advanced data mining techniques to cleanse, merge and prepare data for modeling utilizing predictive modeling, and classification & forecasting algorithms. This work has enabled DTE Energy to better plan their labor and other resources in restoring power in a more efficient manner.
Harnessing the power of data and analytics is the first step in driving operational efficiencies for the business of the future. Stefanini is looking to gain data driven insights into two of their existing call-center processes – inbound call handling process and the existing service ticket creation process. Stefanini currently maintains and captures data related to these two processes separately. The purpose of this project is to combine the call related data with the corresponding tickets and assist Stefanini to gain a better understanding of on what impact the issue types have on the duration of the calls. The analysis will also help Stefanini identify key areas to drive automation, deploy additional employee trainings and optimize the existing staffing models that can eventually generate operational efficiencies for the company. An end-to-end analytics framework was designed by effectively combining the two disparate data sets by utilizing exploratory data analytics, visualization and advanced analytics techniques to generate key insights to help drive efficiencies and automation for Stefanini.

“We were impressed with the analysis and report. The results from this analysis are extremely insightful and will inform our instructional design approach and benefit the colleges we support and collaborate with.”
“The results from this analysis are extremely insightful and will be instrumental for us and the IT Accessibility Assistance Director's strategic efforts to increase and enhance adoption of UDOIT.”

“The deliverables from students’ analyses were insightful and will help us implement the automated alert system for the Application Program Interface Management tool”